
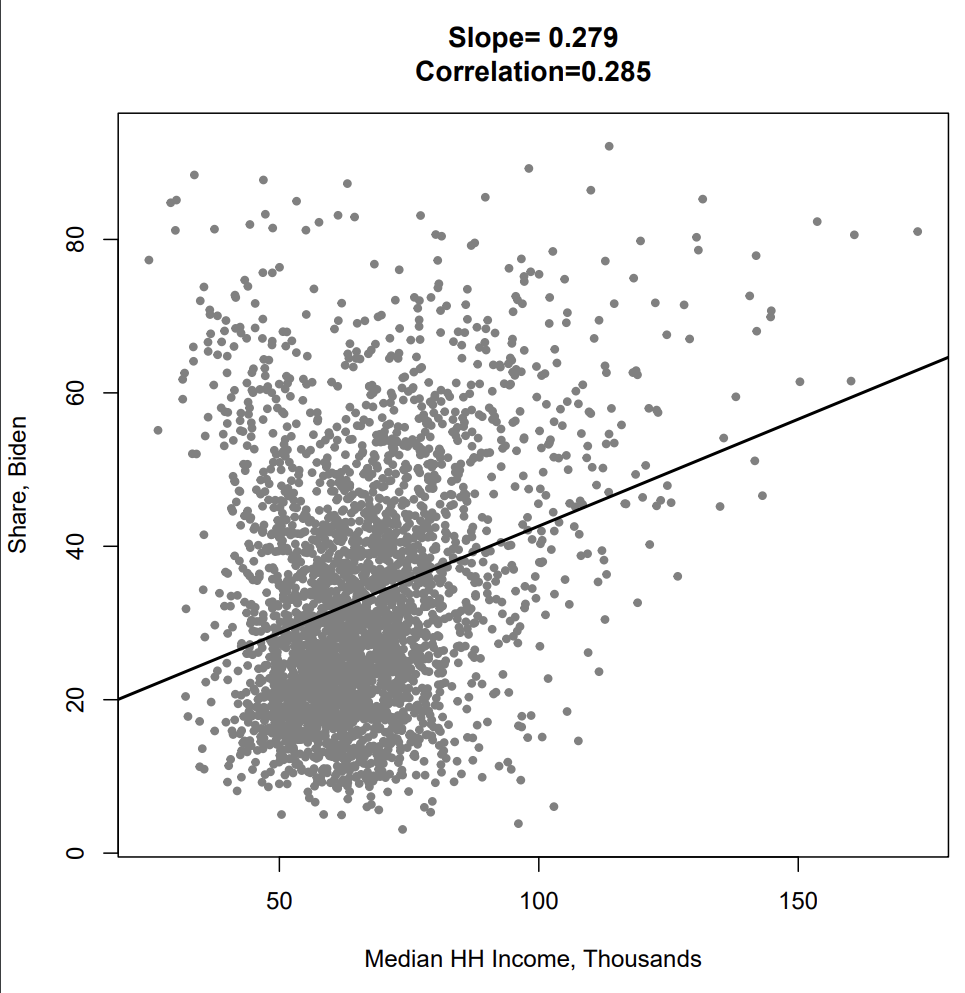
Hypothesis: as household income increases the Biden vote share would decrease .
See right for real-word correlation between these variables:
See below for Data Analysis explaining confounding variables that lead to trend seen in graph.
Data Analysis: Biden Vote Share vs Median Household Income
My hypothesis was that as household income increases the Biden vote share would decrease because higher income individuals would be more inclined to vote for Trump due to his tax policy while in office. In 2017, the Trump Administration implemented the Tax Cuts and Jobs Act (TCJA) which reduced tax rates for all brackets asides from the bottom tax bracket (10%, $0 to $10,275), and changed corporate business tax from a worldwide tax policy to a territorial policy. In contrast, Joe Biden’s 2020 tax proposal aimed to increase income tax rates for high earners from 37% to 39.6%, and corporate tax rates from 21% to 28%. These policy differences made me hypothesize that higher income individuals would not only be in favor of paying lower income tax with the Trump plan, but I believed they would also have a positive outlook on the future economic opportunity with Trump after his first term in office in which he made efforts to bolster American foreign trade and foreign business. My hypothesis was incorrect and as seen in the graph provided to me the correlation was directly opposite from what I predicted. The vote share at the County level for President Biden increased as household income increased up to ≈ $200,000. This is likely due to confounding variables such as Covid-19 and its impacts on the economy. The results may also be contradicting because the graph provided is a county level vote share and in my original hypothesis I intended to refer to specifically high earning individuals and their voting preference but I failed to recognize the context of the variable (Completely my fault).
At the time of the 2020 election the world was in shambles in terms of public health and economic growth. From 2010 to January 2020 the USA GDP was relatively constant, fluctuating at a rate of ≈ 2%. However, in quarter 2 of 2020 the economy plummeted by 32.9% due to the rise of Covid-19 and the closing or restraining of many businesses operating. Many Americans lost their jobs at this time with unemployment sitting at 42% in quarter 2 of 2020 compared to just 29% in Q2 of 2019. This sudden economic downfall may have caused some doubtfulness in voters’ minds about economic stability with the Trump Administration which may have been a confounding variable that led to an influx in votes for Joe Biden. Joe Biden’s campaign strategy to counter the economic recession was to tax the extremely wealthy corporations and provide job stability for middle class workers and small businesses. From a general lens these qualities of his proposed tax policy are extremely attractive to the middle class Americans that were struggling due to Covid related joblessness or reduced business. Additionally, Joe Biden and Donald Trump presented contrasting public health policies in their campaigns. Biden's campaign emphasized a science-based approach to combat the COVID-19 pandemic, focusing on increased testing, contact tracing, mask promotion, and vaccine distribution. Joe Biden also proposed rejoining the World Health Organization. Opposingly, Trump's approach prioritized individual freedoms and reopening the economy over stringent public health measures. Some high-income voters such as small business owners may have seen more stability in the Biden plan. Nonetheless, the Covid-19 epidemic mixed up the general view of Trump's economic policy after the recession began which is likely a confounding variable in the increase of votes for Biden as income increases.
In my original hypothesis I intended to refer to specifically high income households and their candidate preference due to tax policy but I failed to recognize that the variable in question referred to vote share at the county level. This likely explains the opposite correlation compared to my hypothesis because the graph measured the median household income among counties and the vote share by county. In recent time the upper middle class has become increasingly more Democratic and because the graph ended at ≈ $200,000 in median household income we were measuring the voting preference into the upper middle class rather than the extremely high income individuals I intended to refer to. While high-income individuals tend to lean towards conservative candidates (54% of $100,000 or more earners), at the county level, the concentration of high-income voters can vary. Some high-income counties may have more balanced voting patterns due to a broad mix of political beliefs impacted by factors such as regional trends, education levels, and urban-rural divides. Thus, understanding voting patterns based on income requires a more careful approach that considers both individual preferences and the broader demographic landscape within specific regions.
Floyd, David. “Explaining the Trump Tax Reform Plan.” Investopedia, 23 Jan. 2023, www.investopedia.com/taxes/trumps-tax-reform-plan-explained/.
“Understanding Joe Biden’s 2020 Tax Plan.” Committee for a Responsible Federal Budget, www.crfb.org/papers/understanding-joe-bidens-2020-tax-plan. Accessed 28 July 2023.
“Tax Cuts and Jobs Act: A Comparison for Businesses.” Internal Revenue Service, www.irs.gov/newsroom/tax-cuts-and-jobs-act-a-comparison-for-businesses. Accessed 28 July 2023.
“United States GDP Growth RATE2023 Data - 2024 Forecast - 1947-2022 Historical.” United States GDP Growth Rate - 2023 Data - 2024 Forecast - 1947-2022 Historical, tradingeconomics.com/united-states/gdp-growth. Accessed 28 July 2023.
“29 September Quarterly Labour Force Survey (QLFS) – Q2:2020.” Statssa.Gov.Za, www.statssa.gov.za/?p=13652#:~:text=The%20unemployment%20rate%20according%20to%20the%20expanded%20definition,work%20but%20did%20not%20actively%20look%20for%20work. Accessed 28 July 2023.
Pew: Covid-19 Hurt Lower- and Middle-Income Americans the Most As ..., www.usnews.com/news/economy/articles/2022-04-20/pew-covid-19-hurt-lower-and-middle-income-americans-the-most-as-middle-class-shrinks-over-past-50-years. Accessed 28 July 2023.
Published by Statista Research Department, and Sep 30. “2020 Presidential Election Exit Polls: Share of Votes by Income U.S. 2020.” Statista, 30 Sept. 2022, www.statista.com/statistics/1184428/presidential-election-exit-polls-share-votes-income-us/.